About Me
Sadhana Rani Sankar Narayan
Data Analyst & Application developer
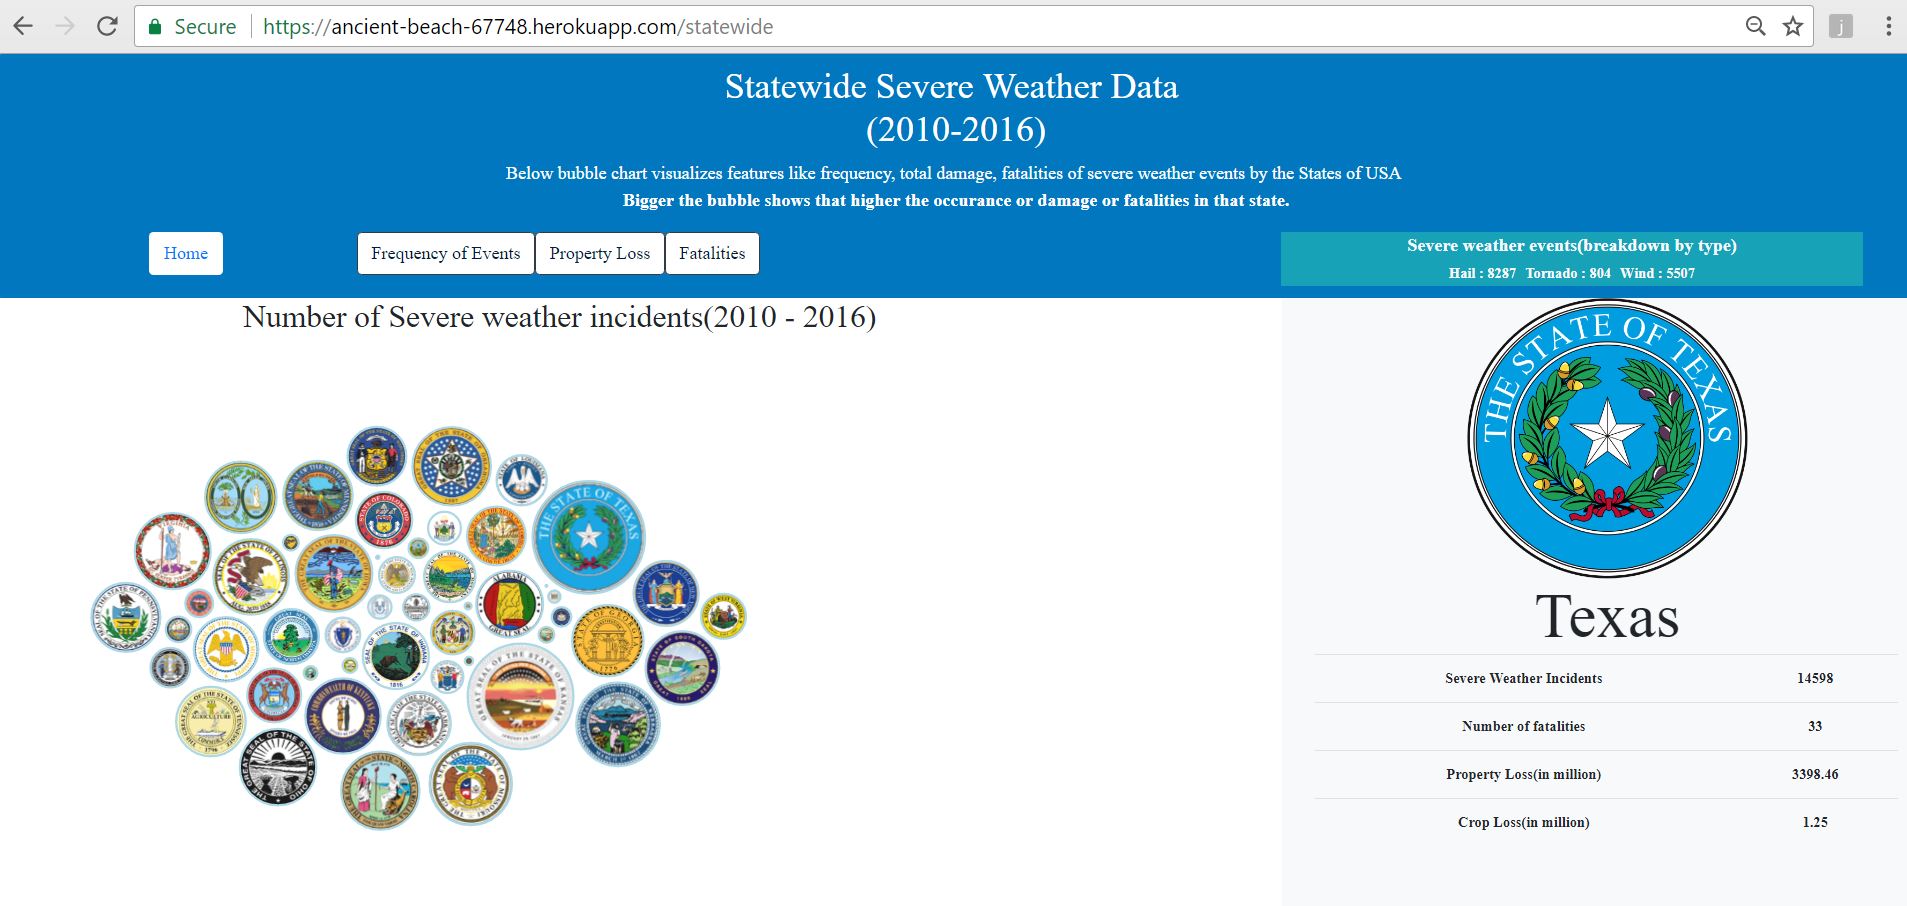
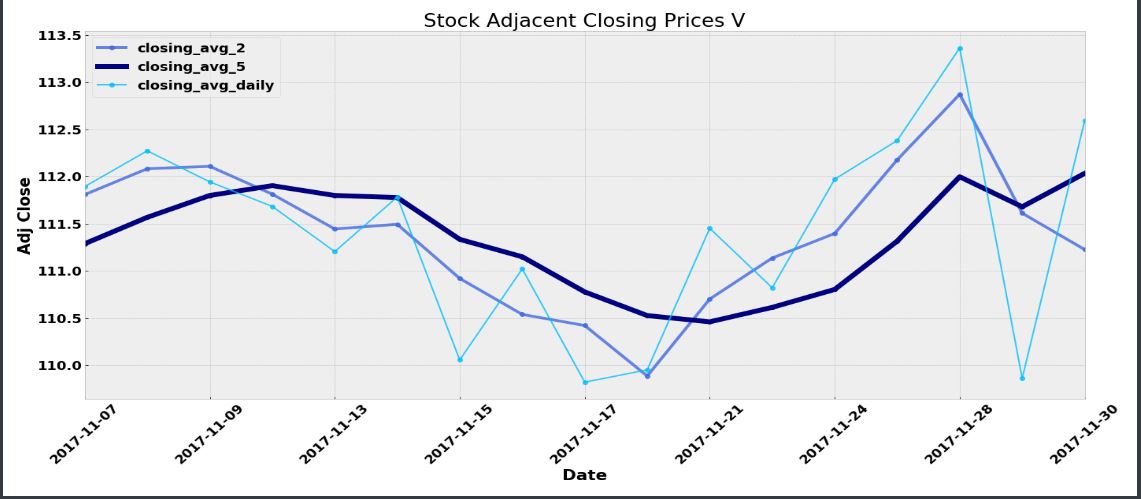
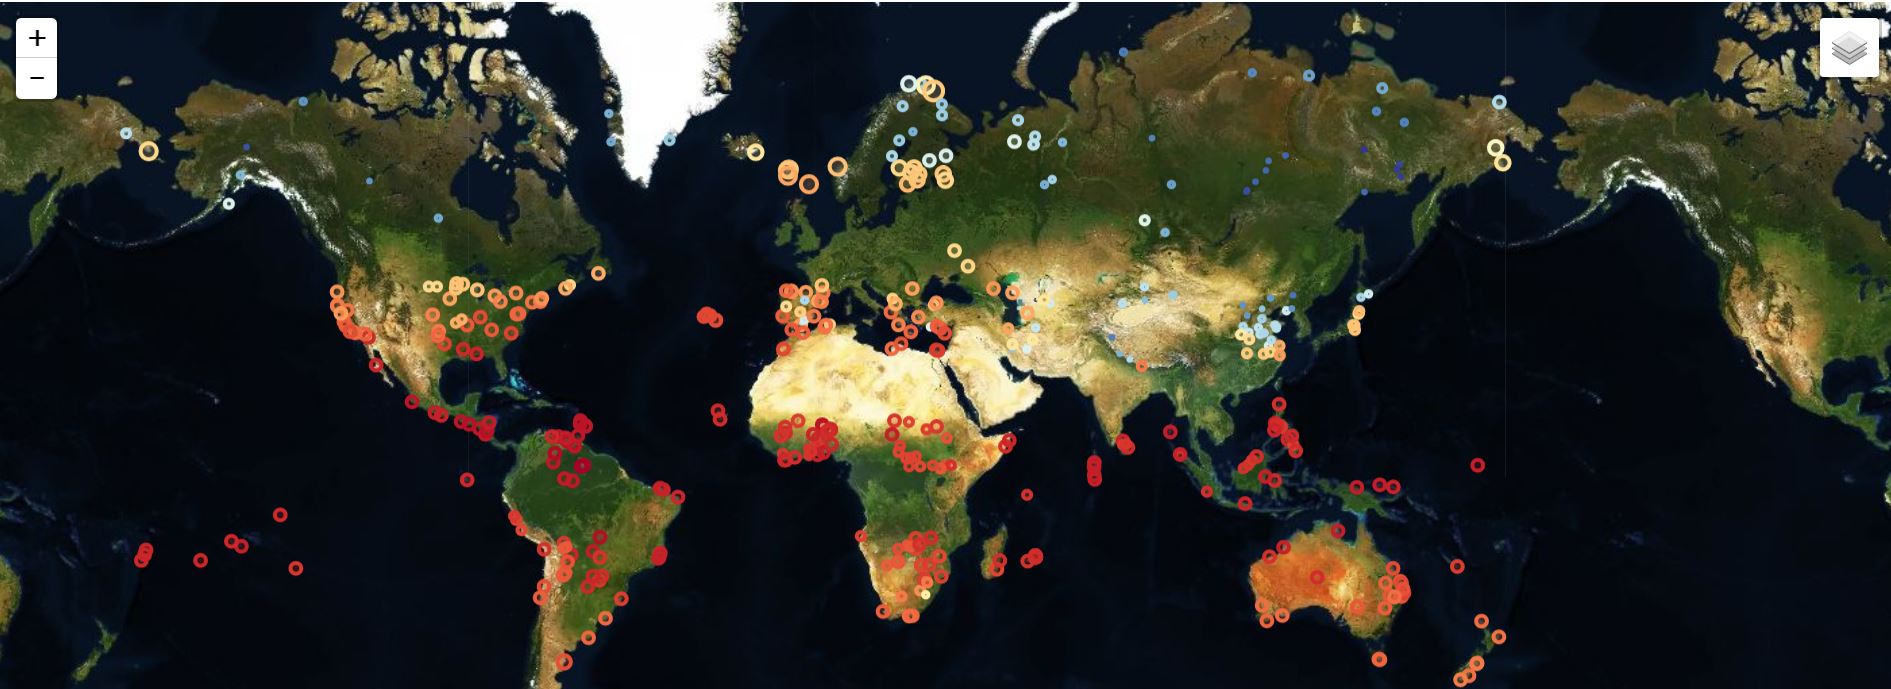
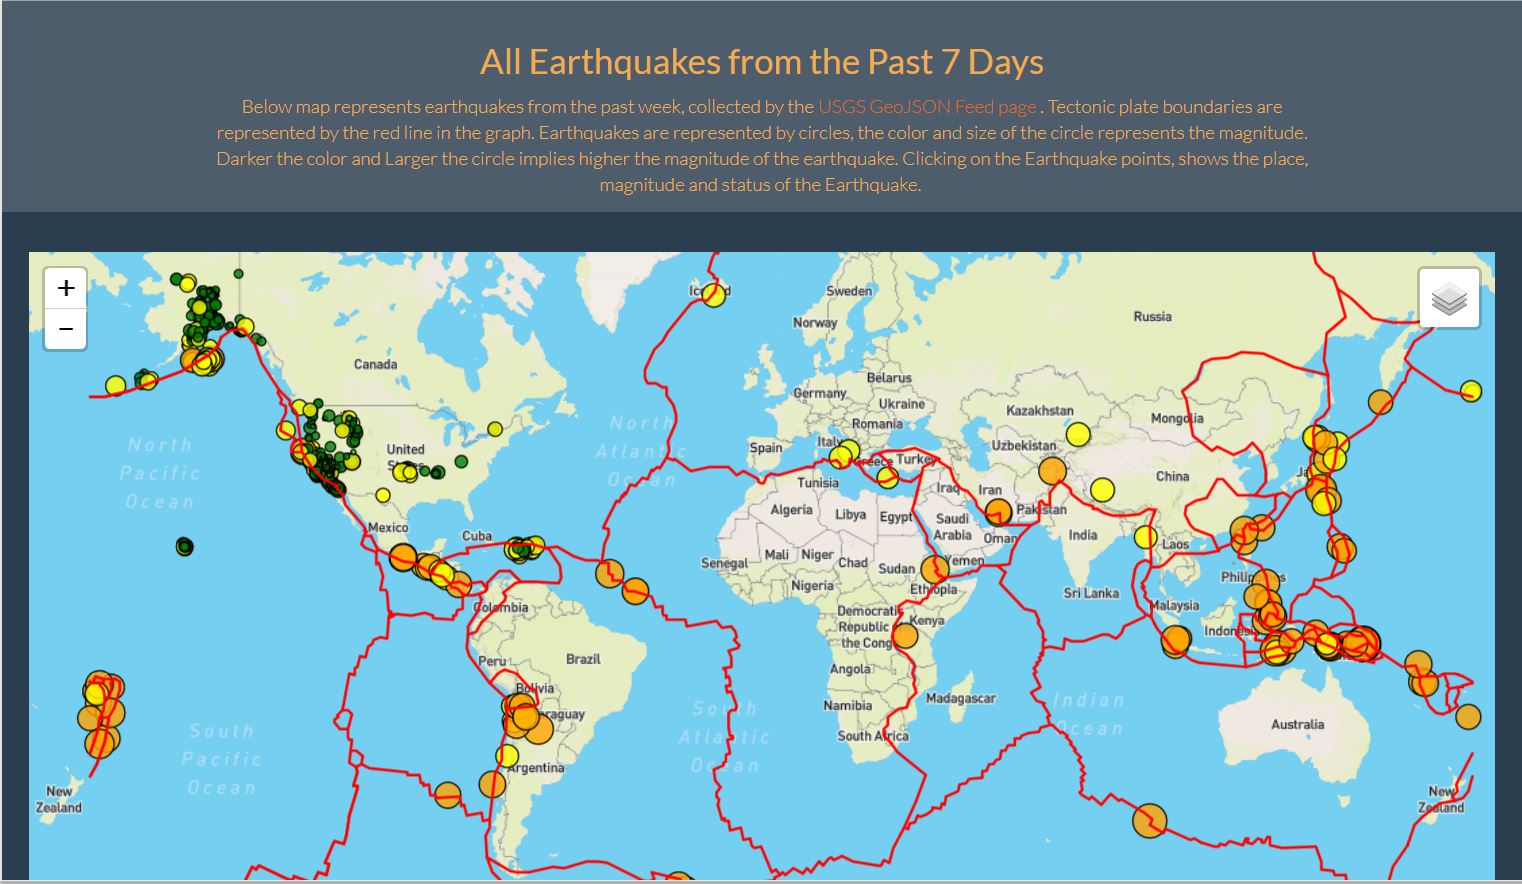
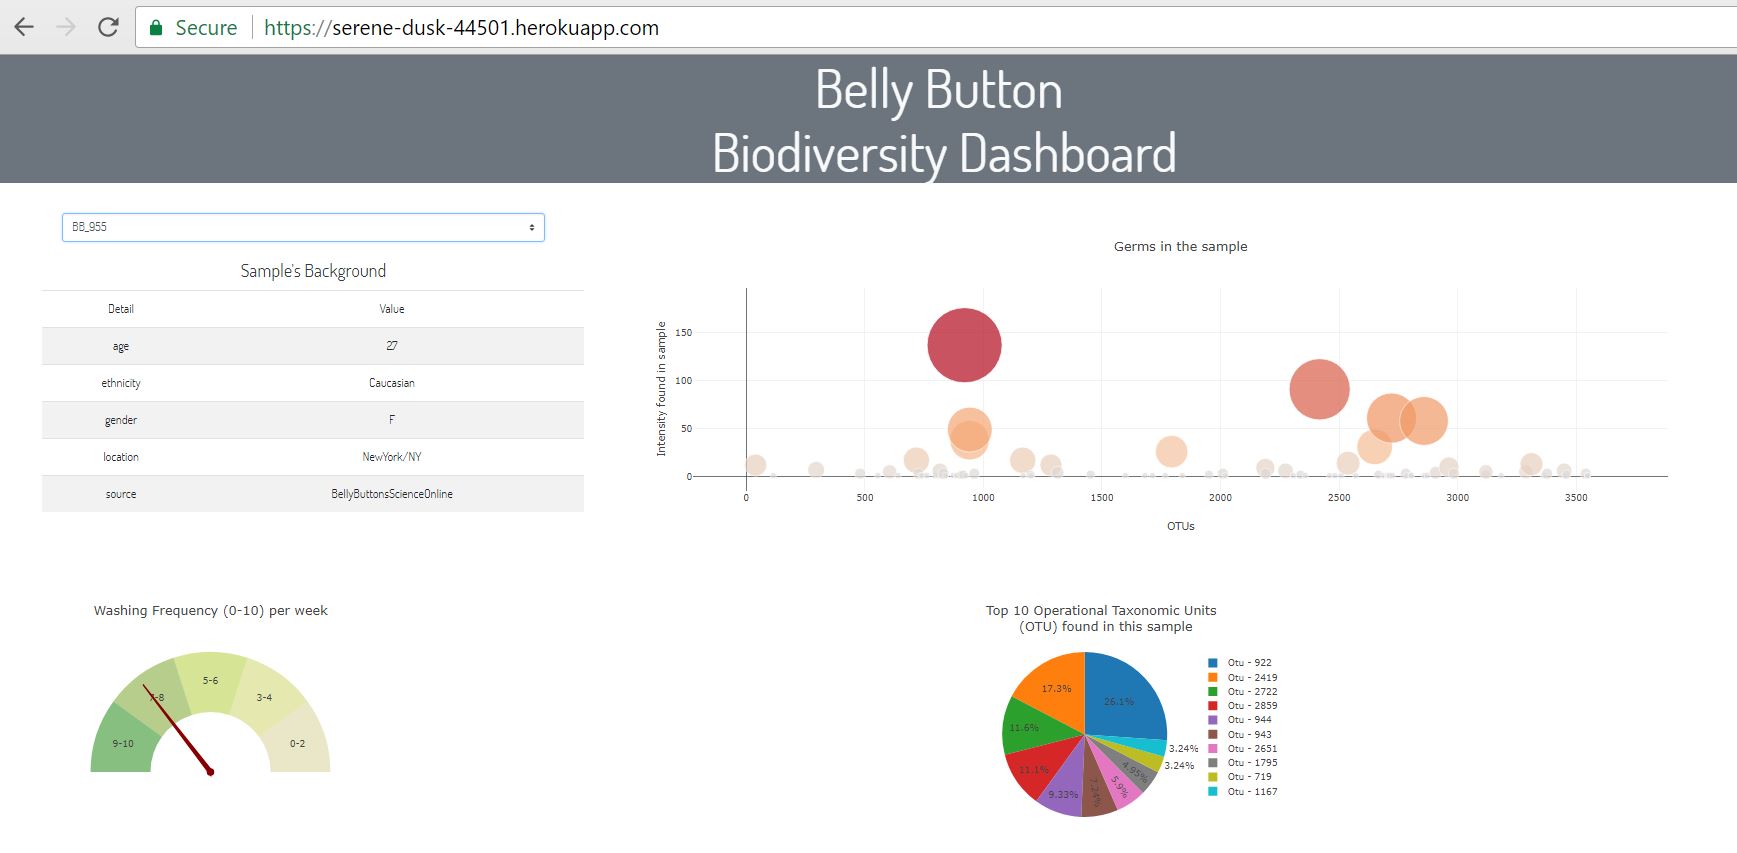
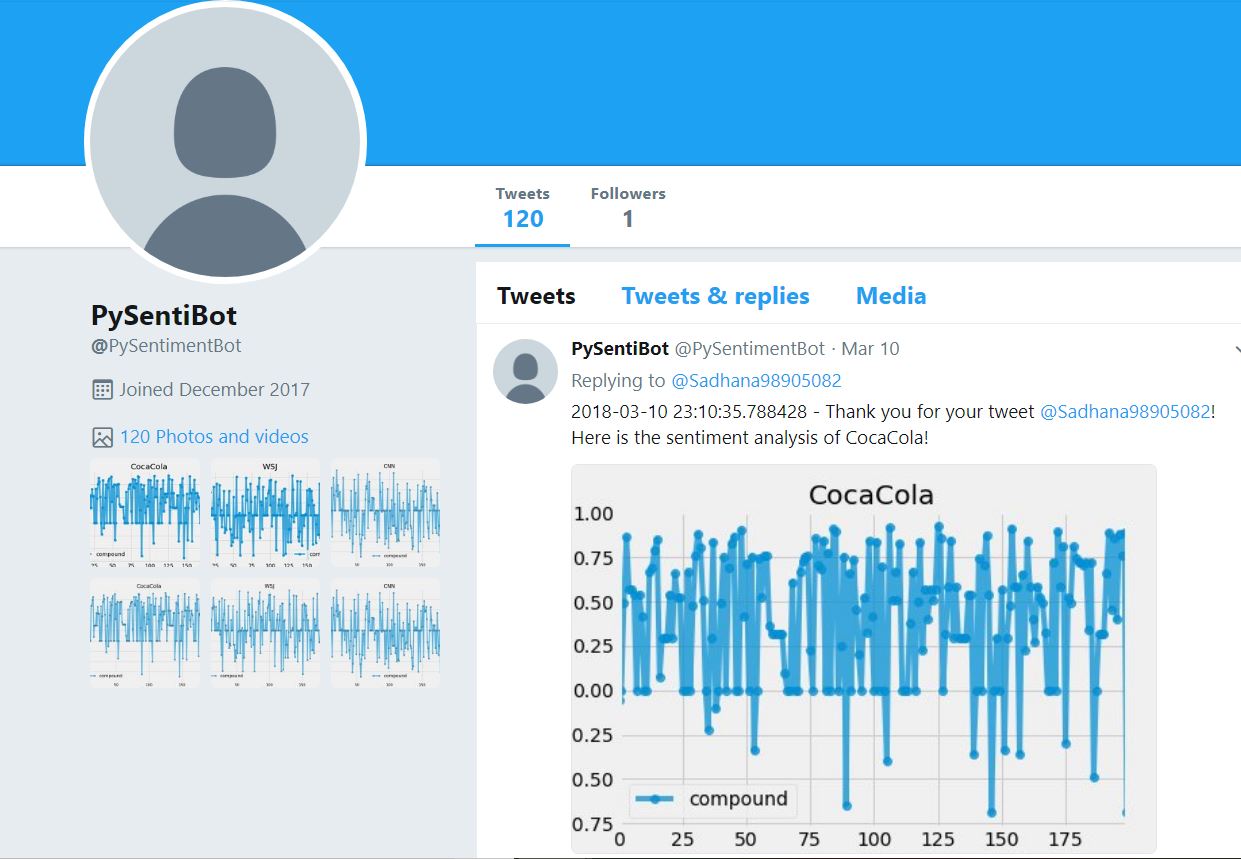
Below are some of my projects to showcase my skills in Python, Pandas, Matplotlib, Numpy, Seaborn, Javascript, D3, Plotly, Leaflet etc. in application development and data analysis.
Exploratory data analysis and visualization, full stack development project. Data analysis of hailstorms, tornados, and severe wind events that occurred in the USA from 2010-2016 using Python, Pandas, Plotly, Leaflet and D3.js.
Exploratory data analysis project to study Social media (Twitter) sentiments and Stock market information. Data analysis and visualization is acheived using Python libraries namely Pandas, Matplotlib, Tweepy, SentimentAnalyzer.
Data's true power lies in its ability to answer questions definitively. Attempting to answer a fundamental question: "What's the weather like as we approach the equator?"
Now, we all might think, "Duh. It gets hotter..."
But Proving it is the fun part!
A Leaflet js based visualization that shows all earthquakes from the past week along with the tectonic plates.
An interactive dashboard implementation of the famous belly button bio diversity dataset using Python, Flask, SQLite, Plotly and D3.js.
Social Media Analysis Project. Sentiment Analysis of tweets on Twitter pages. Twitter Bot listens for requests on sentiment analysis and posts back an image of the analysis to the tweeter.
@PySentimentBot
Thanks again for stopping by!
Feel free to look around more.
Be it for work opportunities or to pair up for potential projects or to just socialize, I'll be glad to hear from you, reach out anytime with a note.
I'll get back to you as quickly as I can.