Tweet Street
Exploratory data analysis project to study Social media (Twitter) sentiments and Stock market information.
Both values are collected for a period of 1 month (Nov-2017) and Overall period of 10 years for specific industry study.
We have picked 7 famous companies from various industries and collected tweet sentiments and stock market information.
Data analysis and visualization is acheived using
Python libraries namely
Pandas, Matplotlib, Tweepy, SentimentAnalyzer.
Introduction
Tweet Street is a data analysis project to identify if any correlation exists between tweet sentiments and stock prices.
-
Our target stocks are as follows:
- Amazon
- Apple
- Macy's
- Netflix
- Nike
- Visa
- Walmart
-
We have the following visualizations in place:
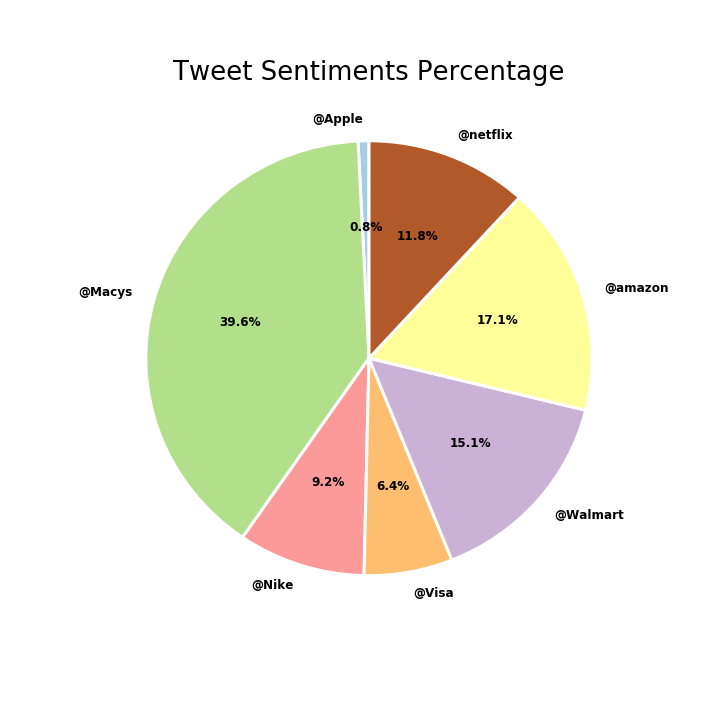
- Percentage comparisons of all target stocks (Pie charts)
- Overall Stock closing prices vs Tweet Sentiments (Bar charts)
- Daily stock prices vs Tweet Sentiments
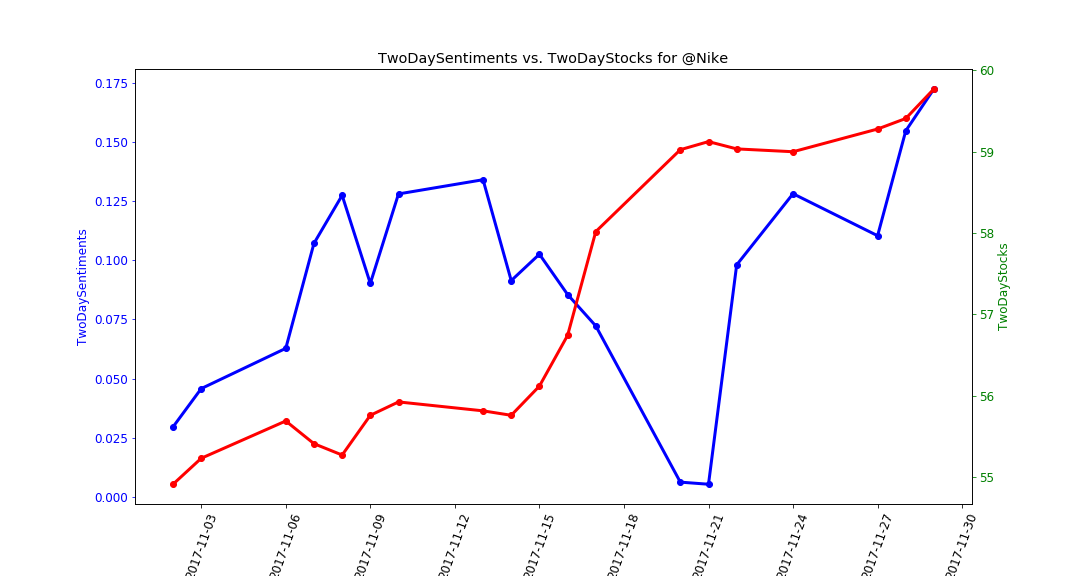
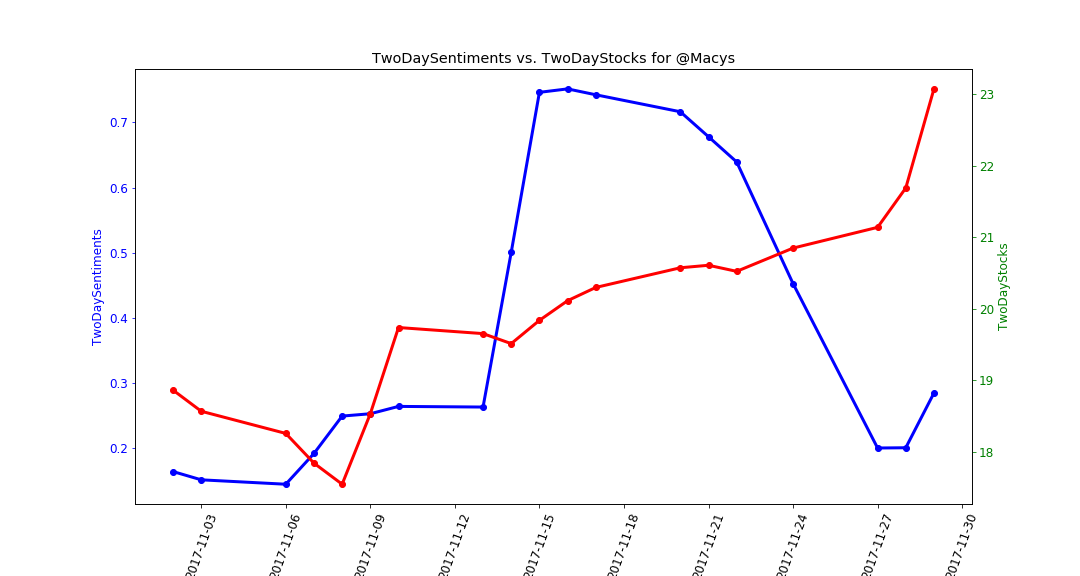
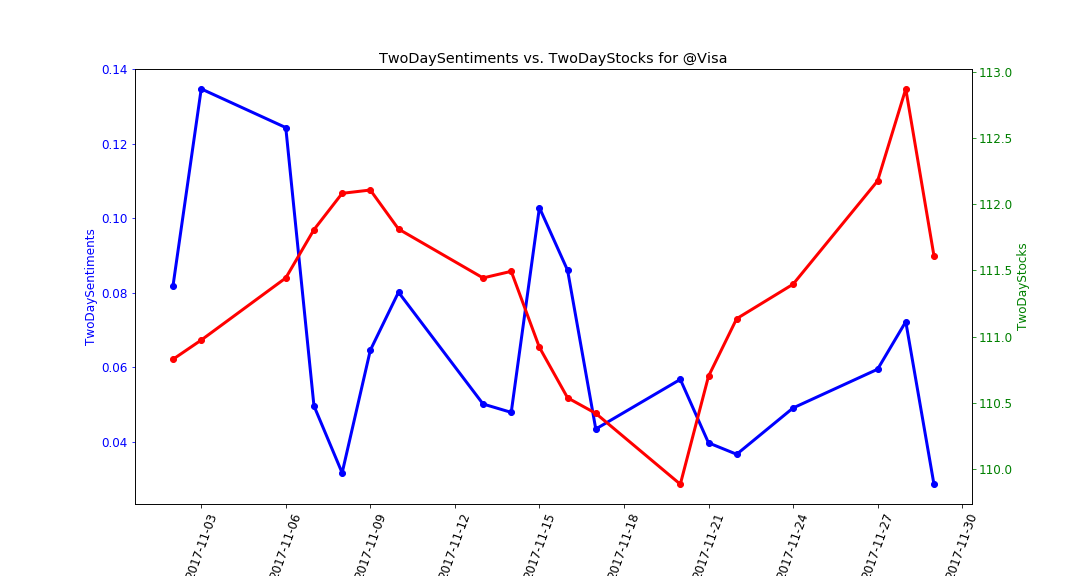
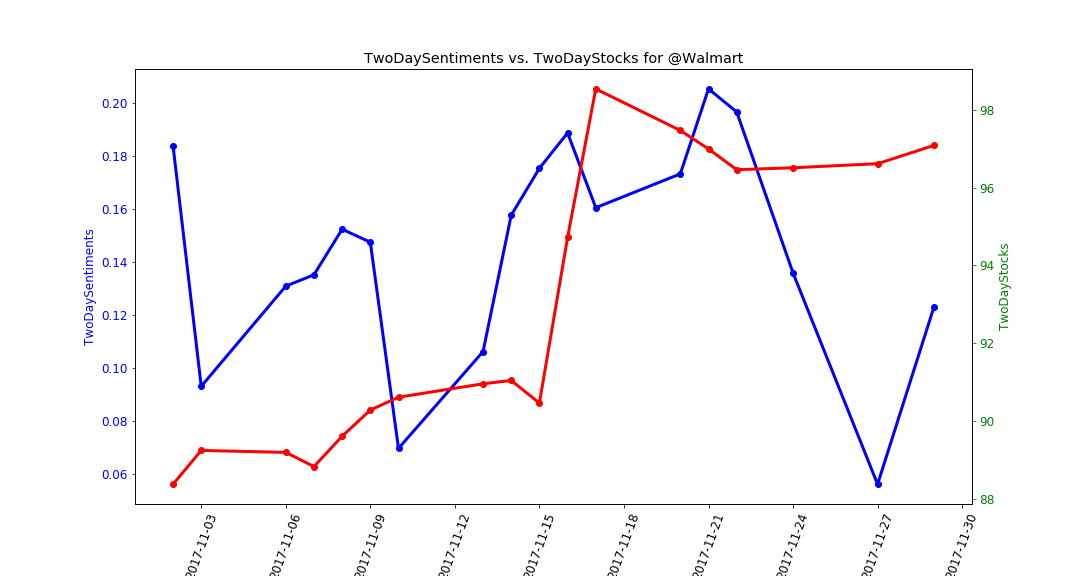
- Two day moving averages of stock prices vs Tweet Sentiments
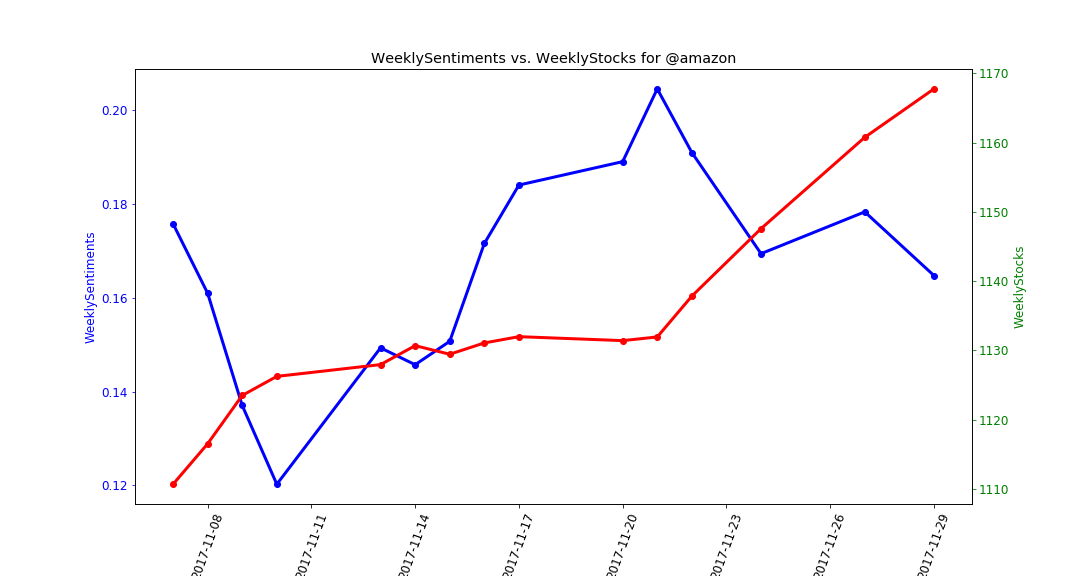
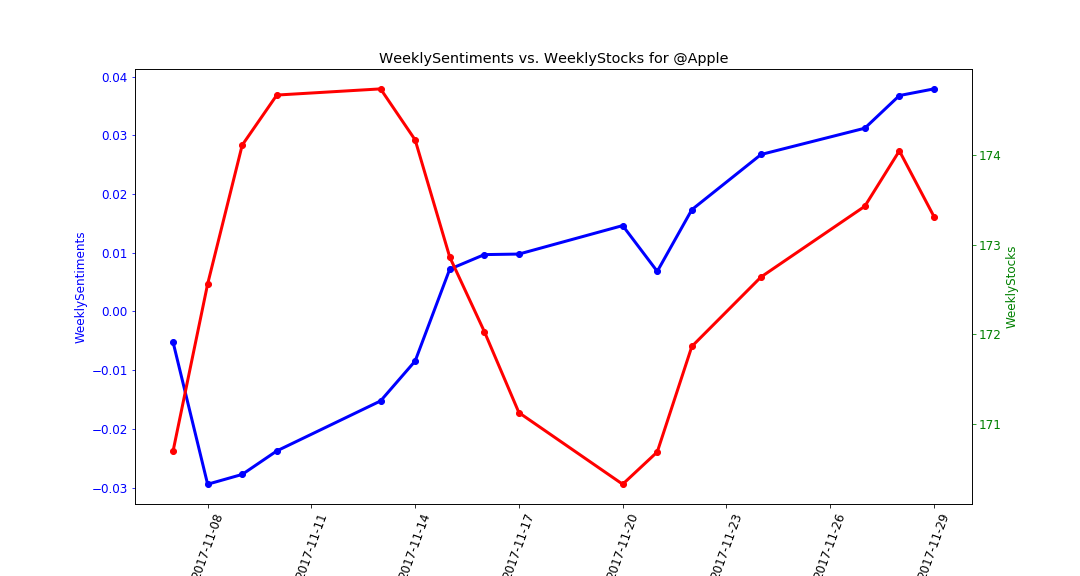
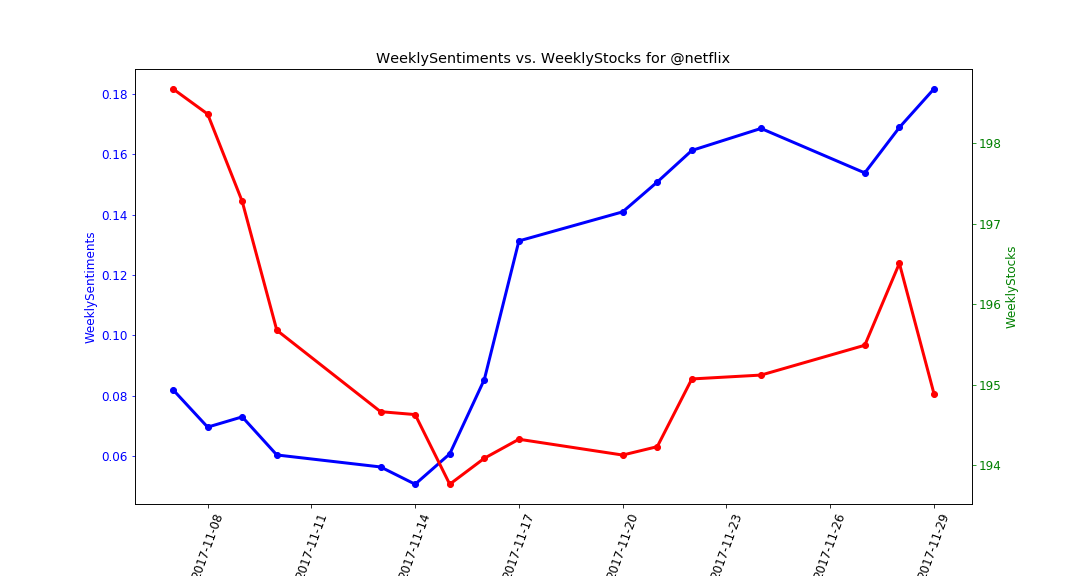
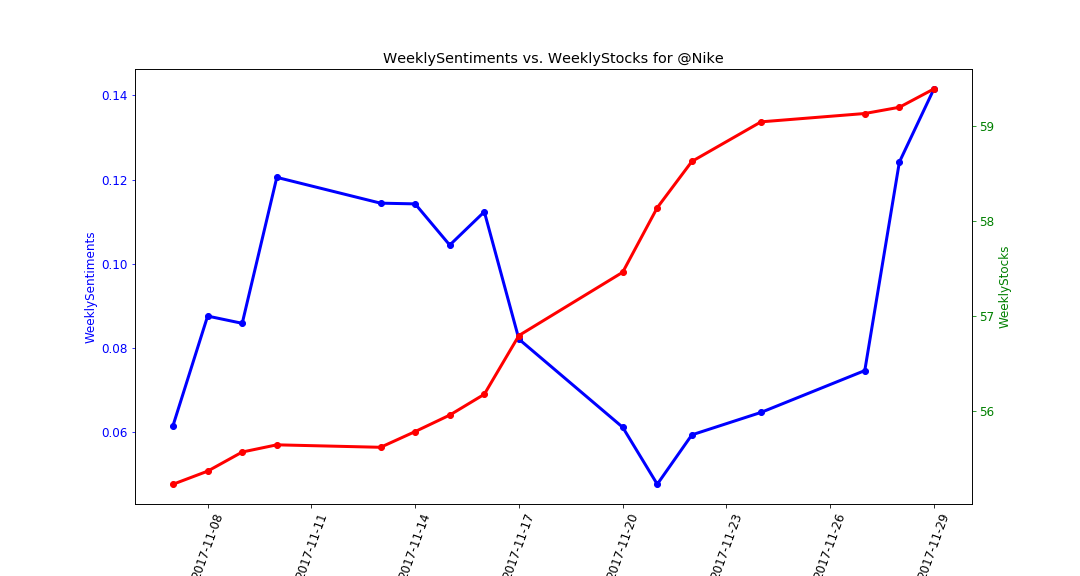
- Weekly moving averages of stock prices vs Tweet Sentiments
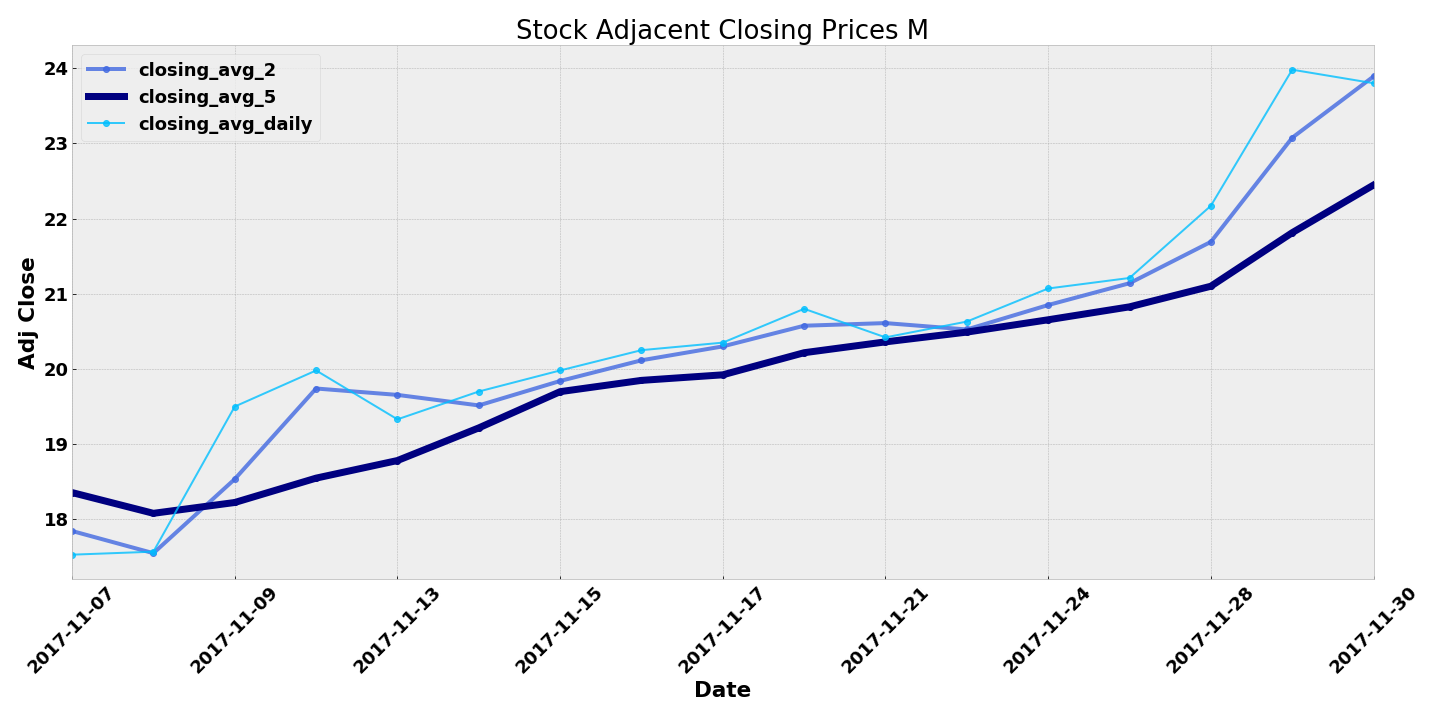
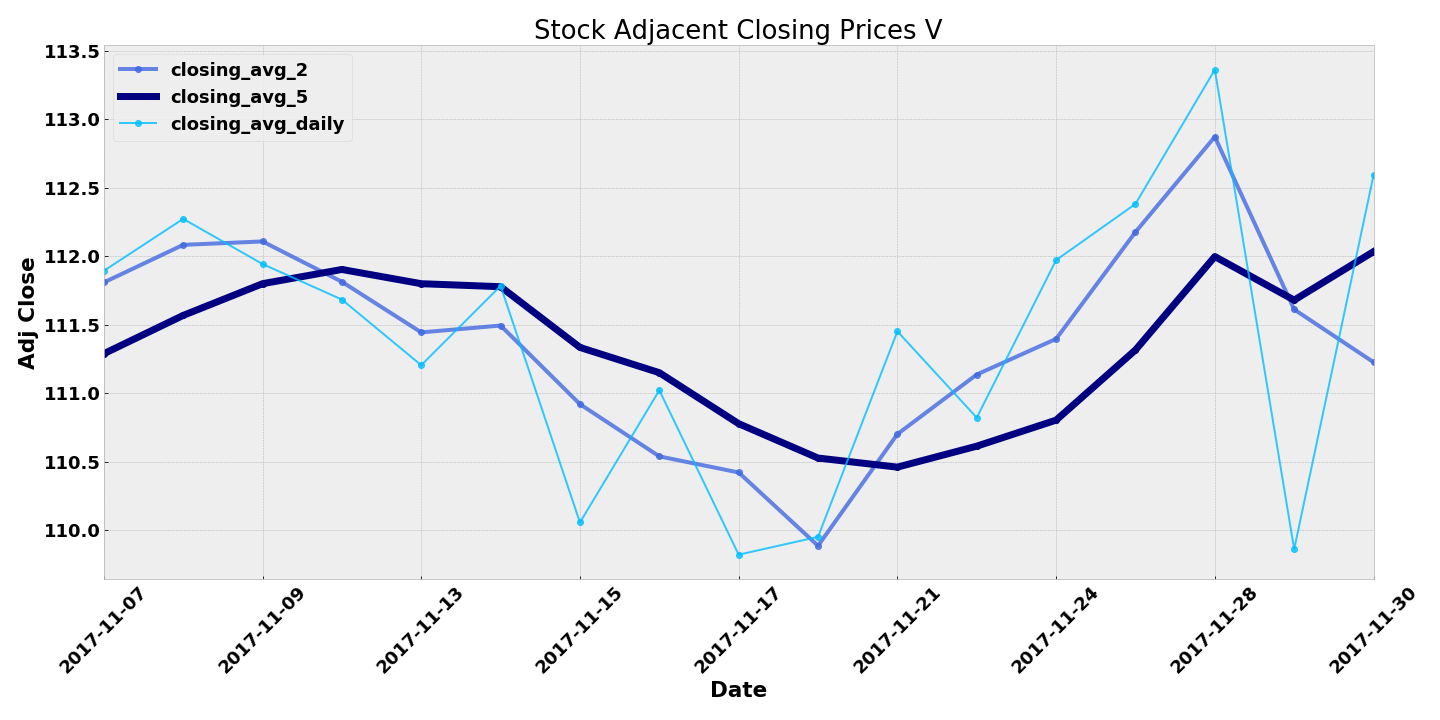
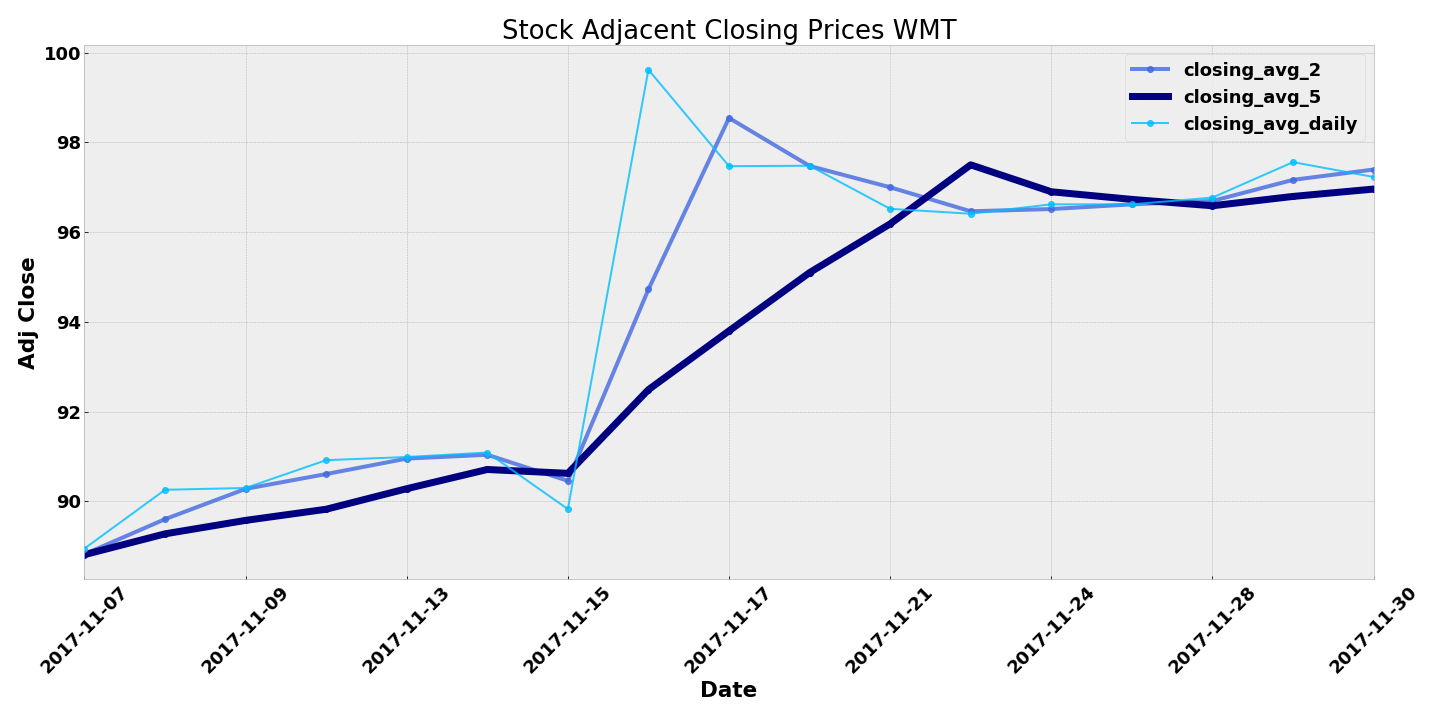
- Stock prices (daily, two-day, weekly) averages
- Individual stock and tweet charts
Data Sources:
- Jefferson-Henrique GitHub Project (Historic Tweets), Tweepy (Daily Tweets)
- Yahoo Finance(Historic Stocks), IEX API(Daily Stocks)
Percentage comparisons of all target stocks (Pie charts)

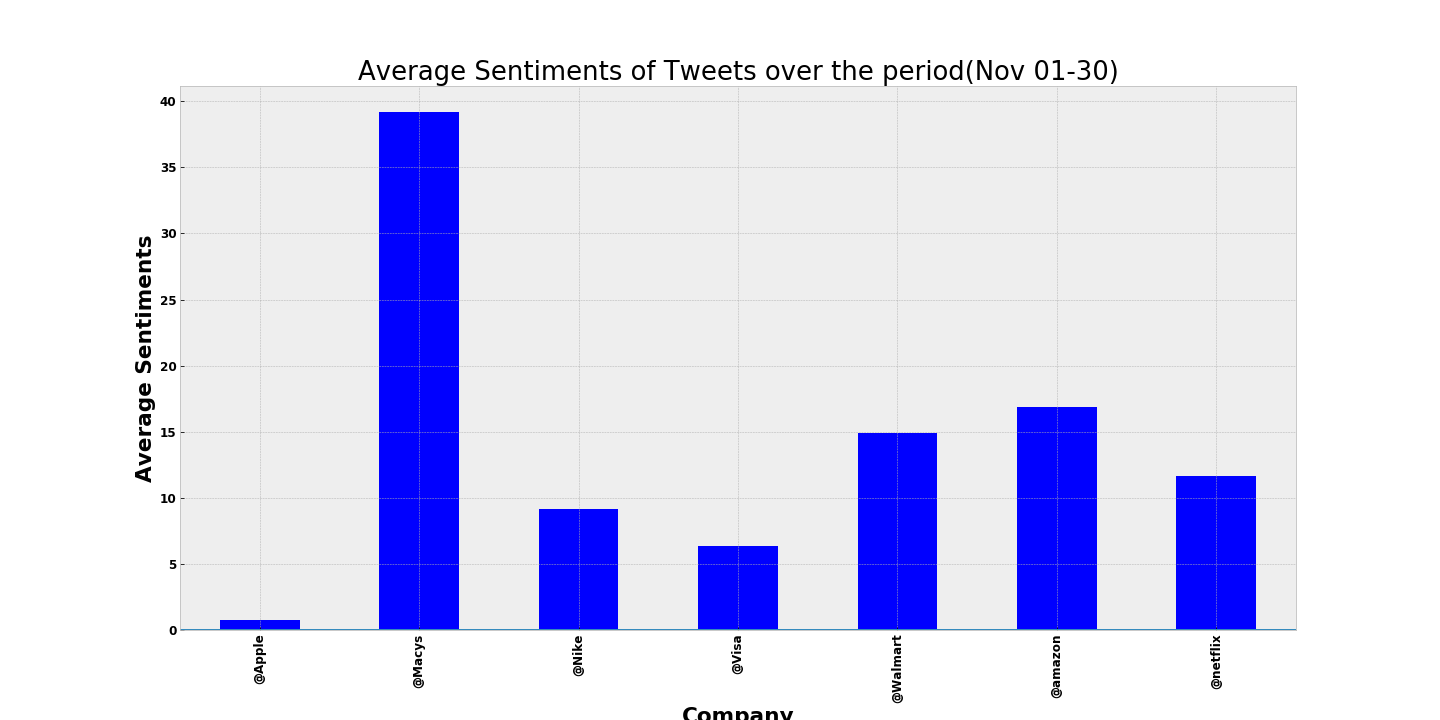
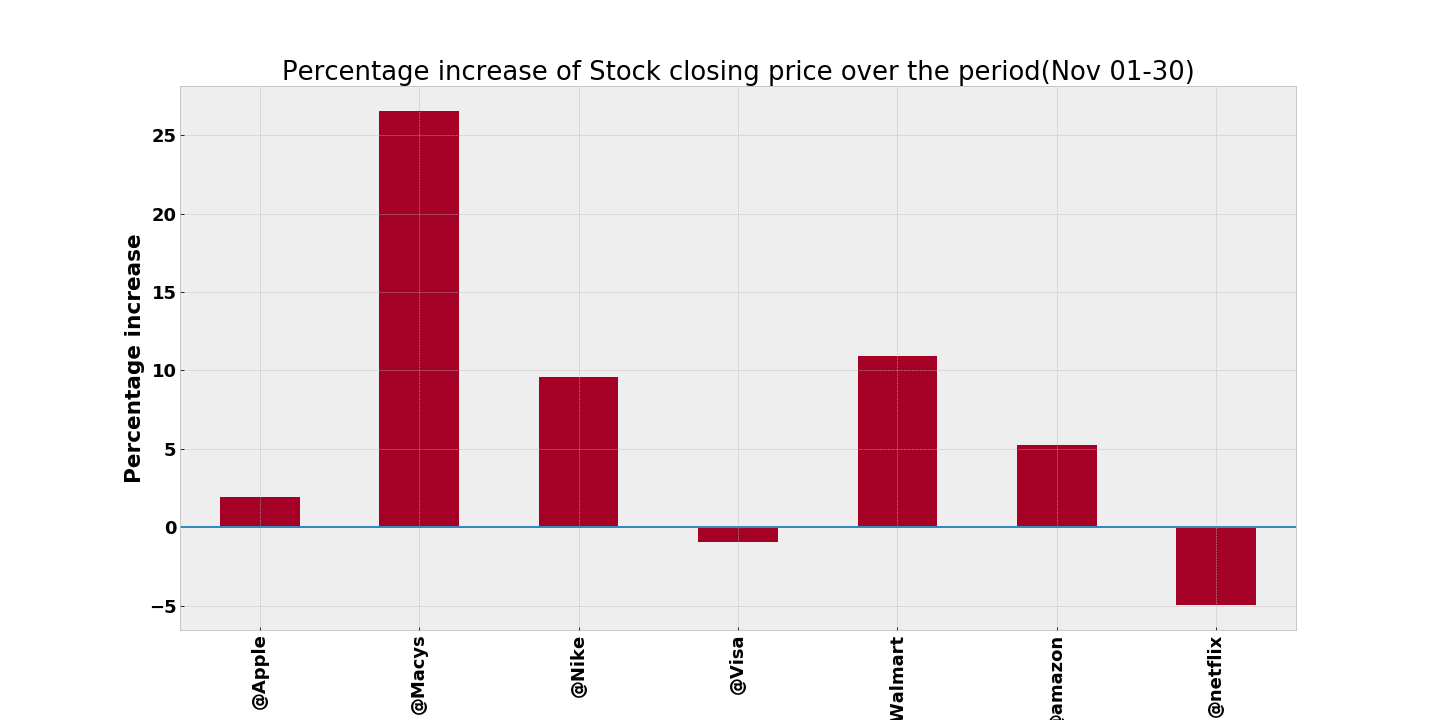
Overall Stock closing prices vs Tweet Sentiments (Bar charts)
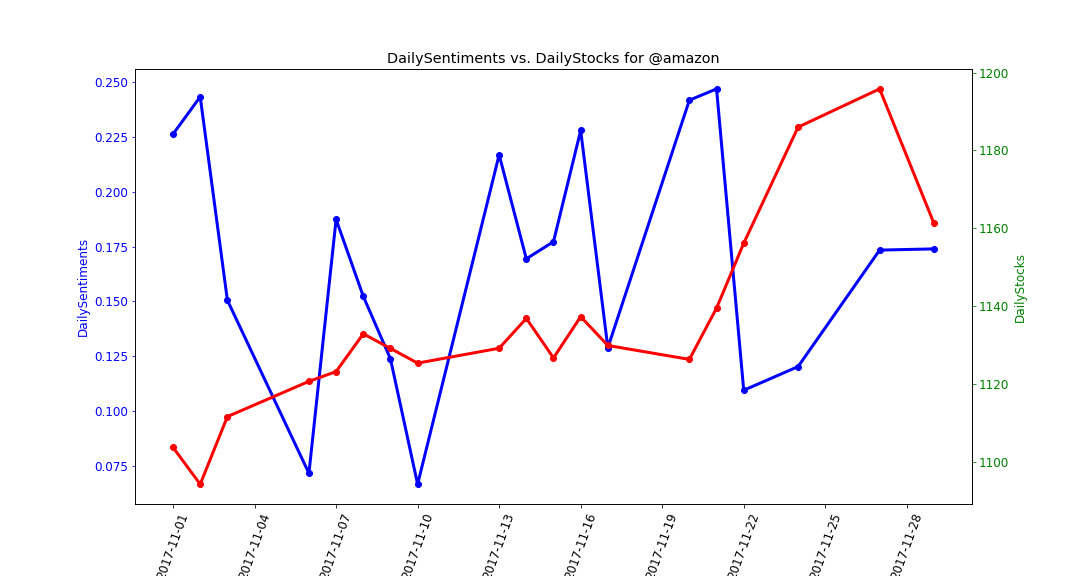
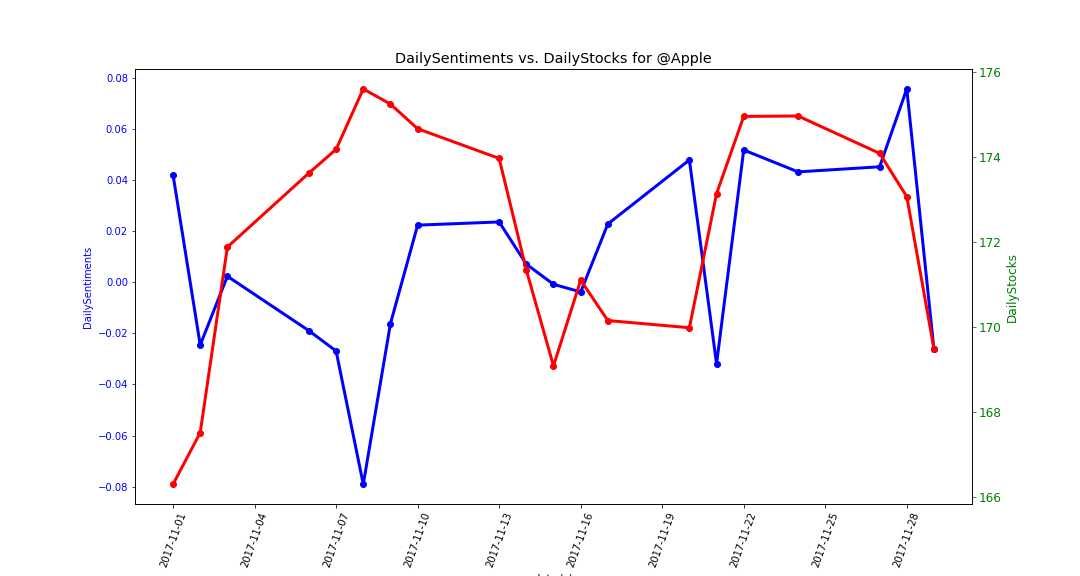
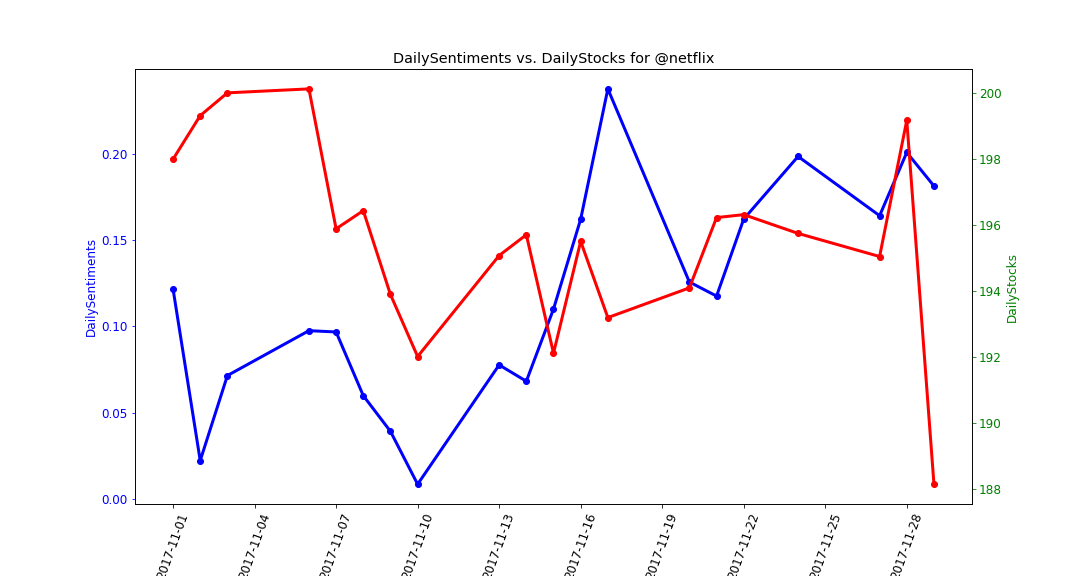
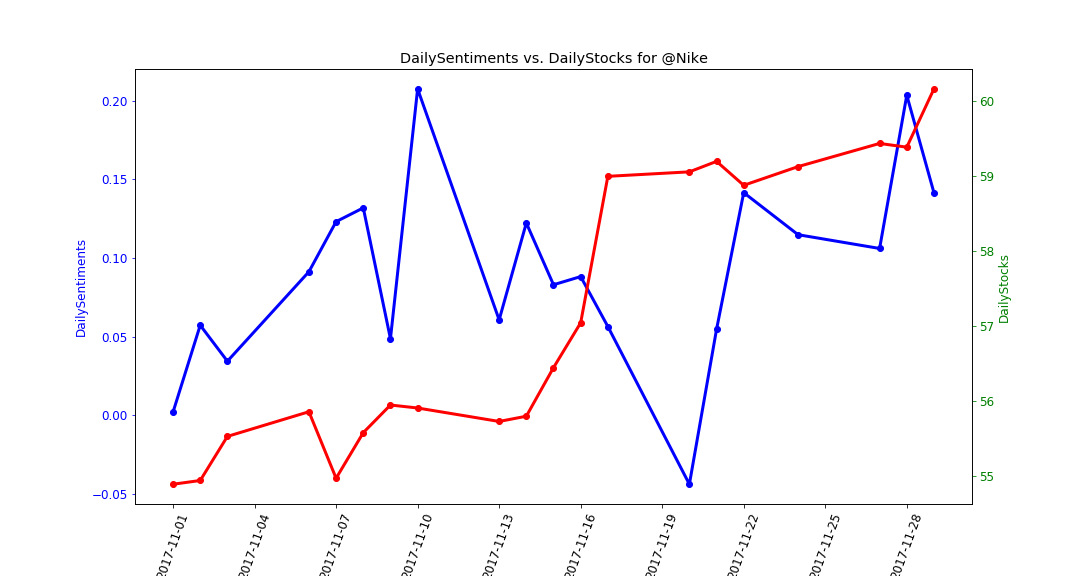
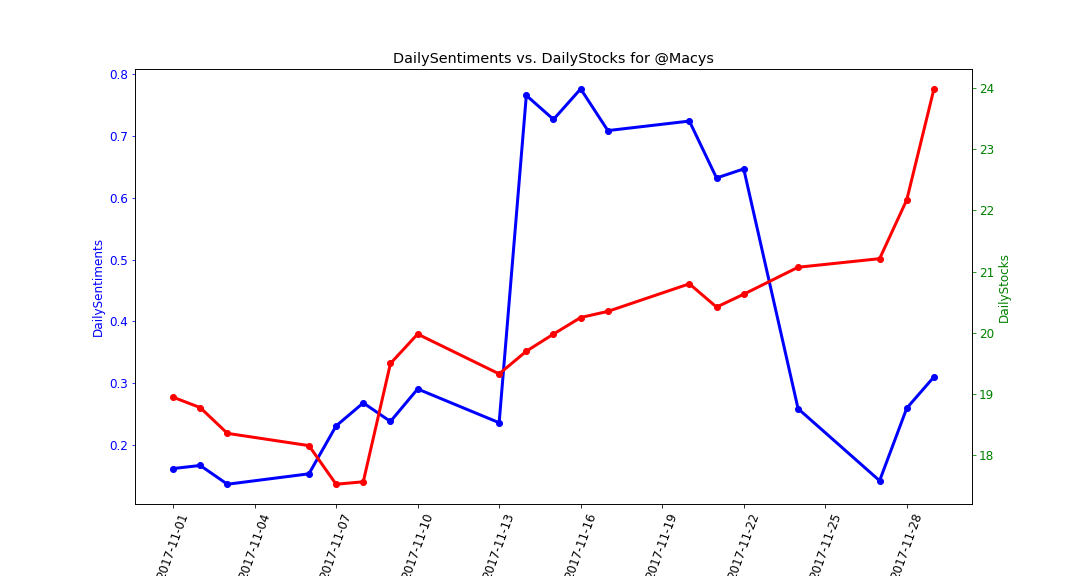
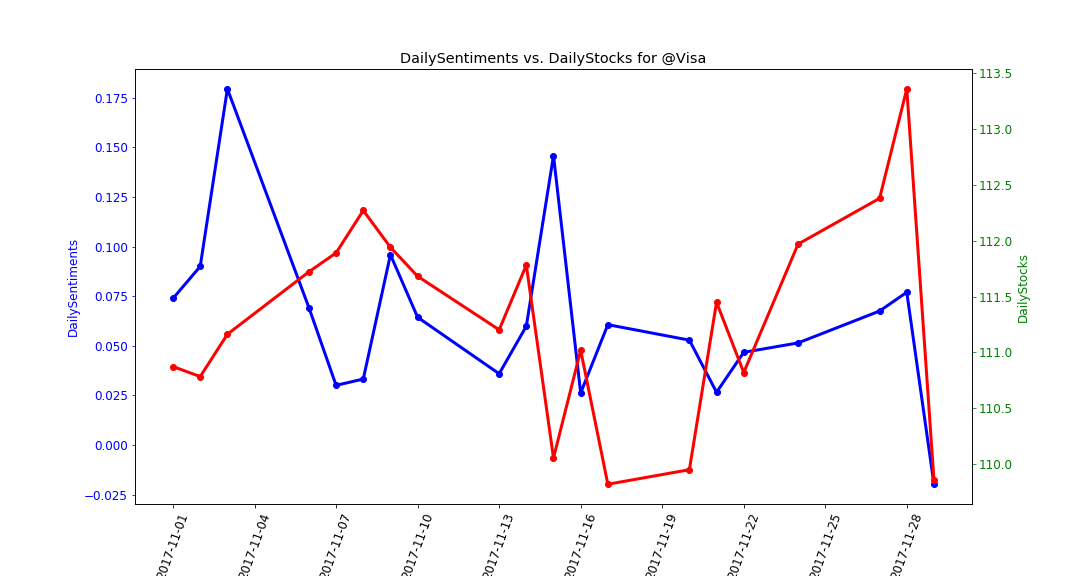
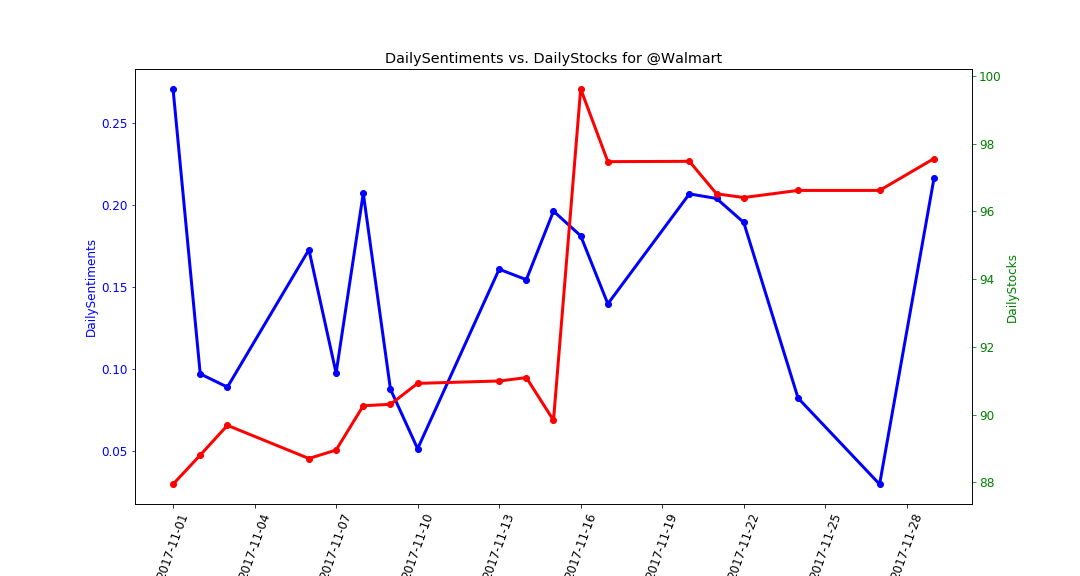
Daily stock prices vs Tweet Sentiments
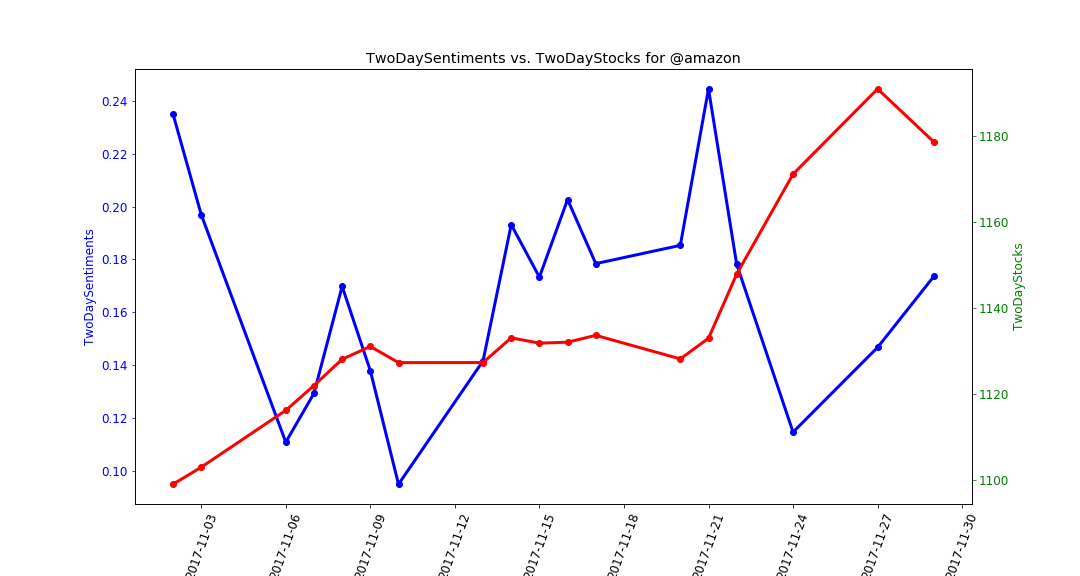
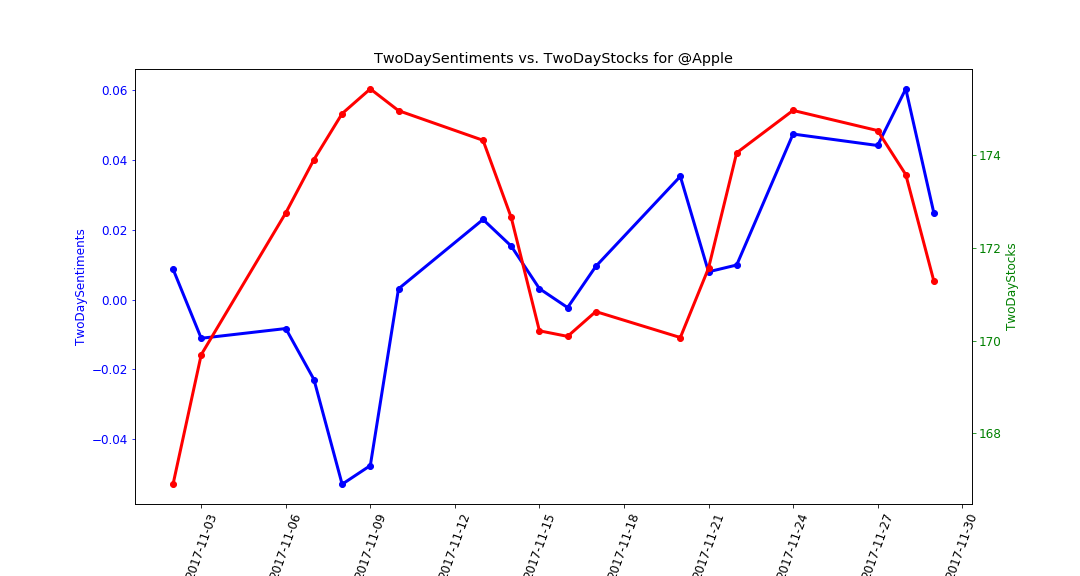
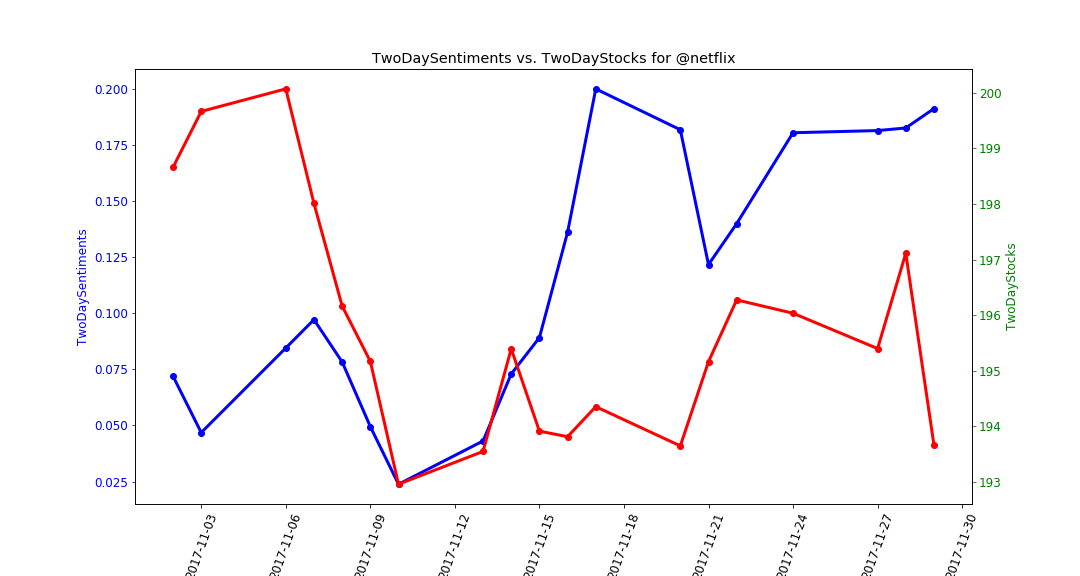
Two day average stock prices and sentiments
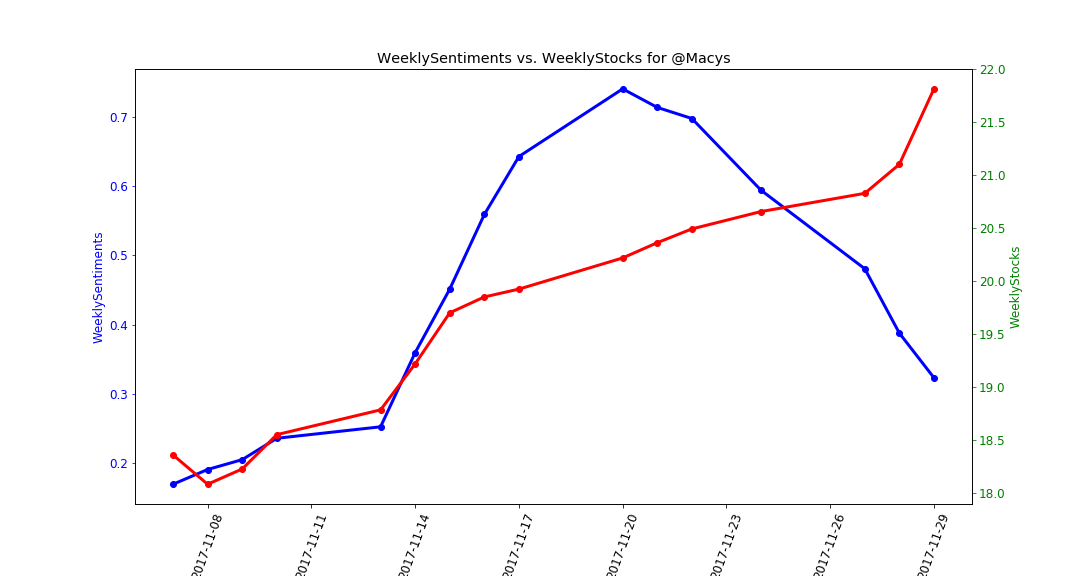
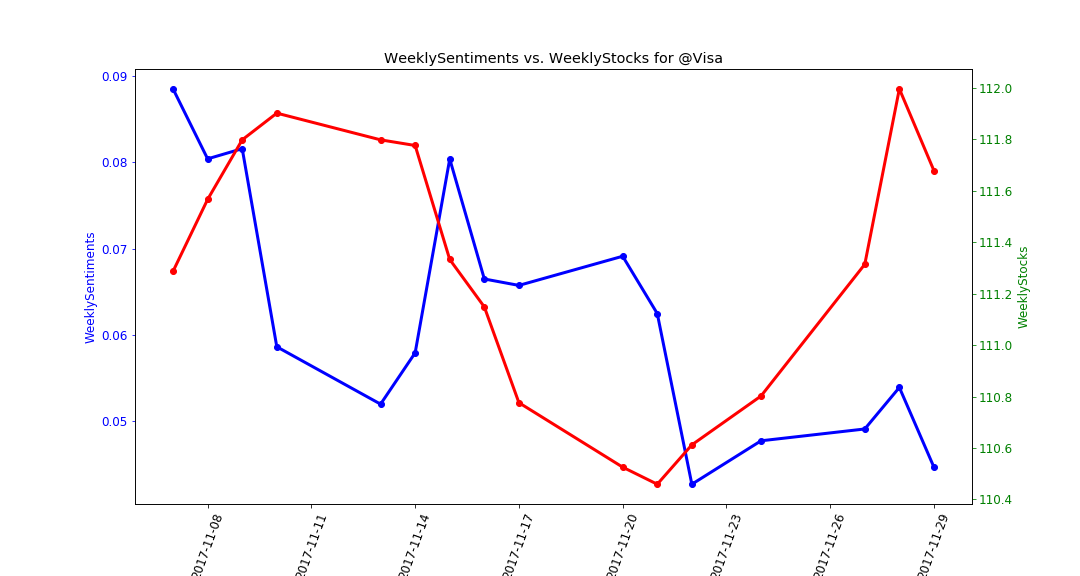
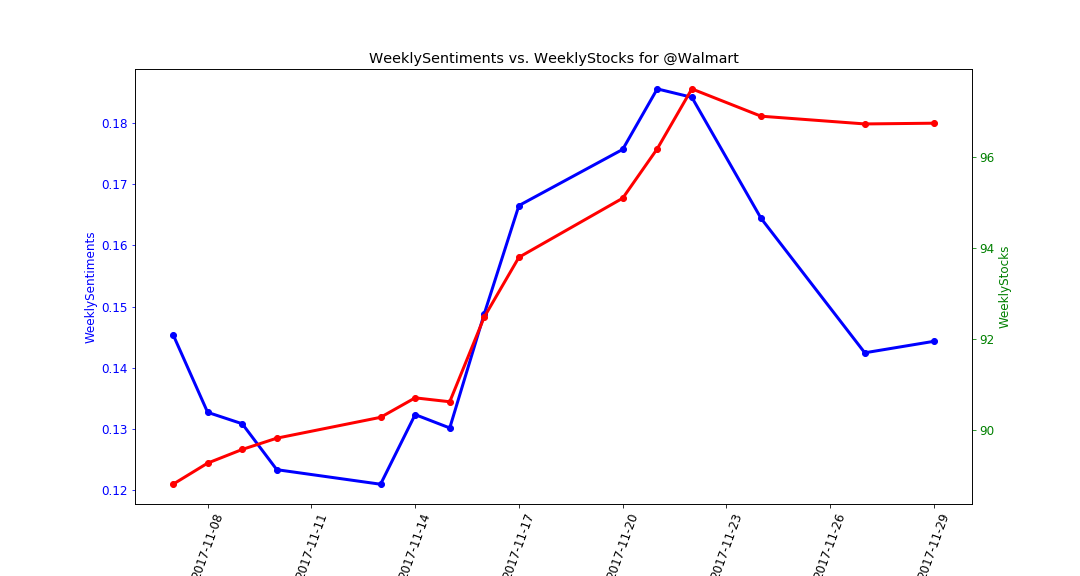
Weekly average stock prices and sentiments
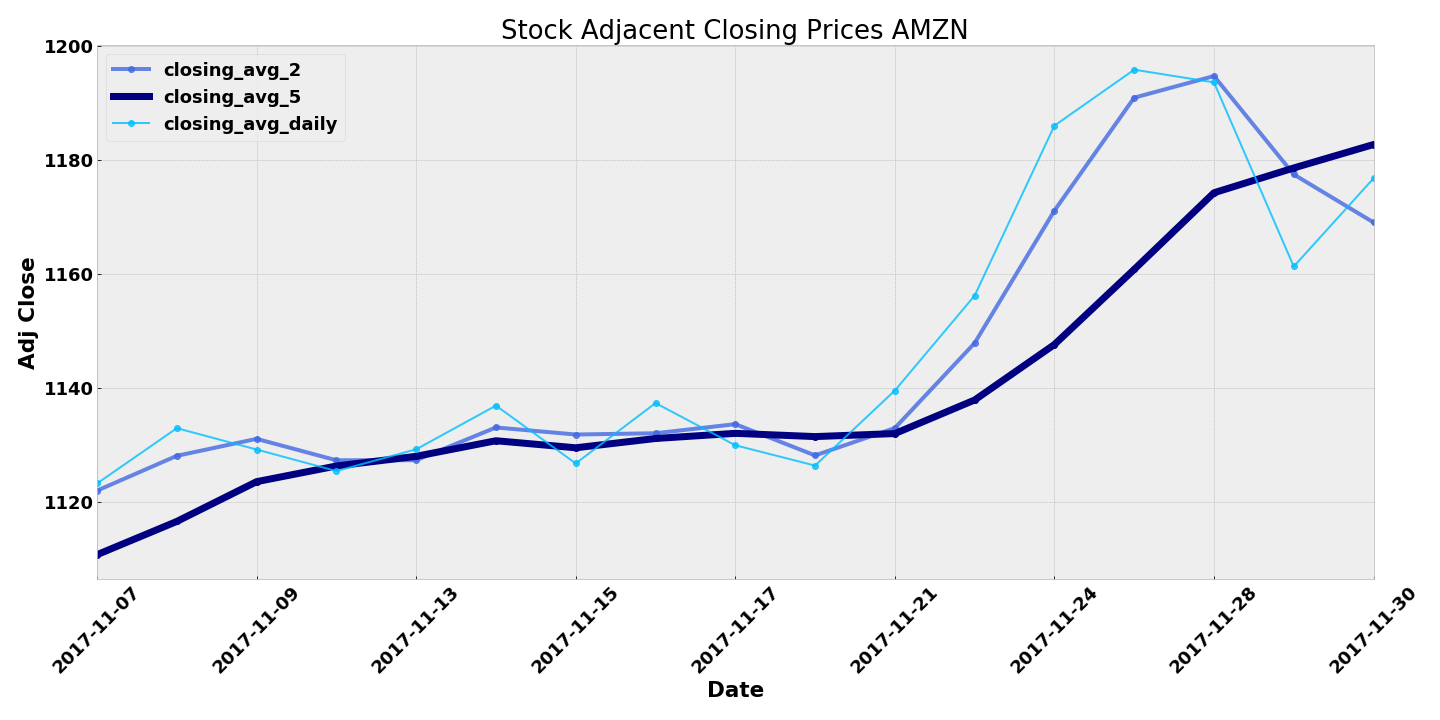
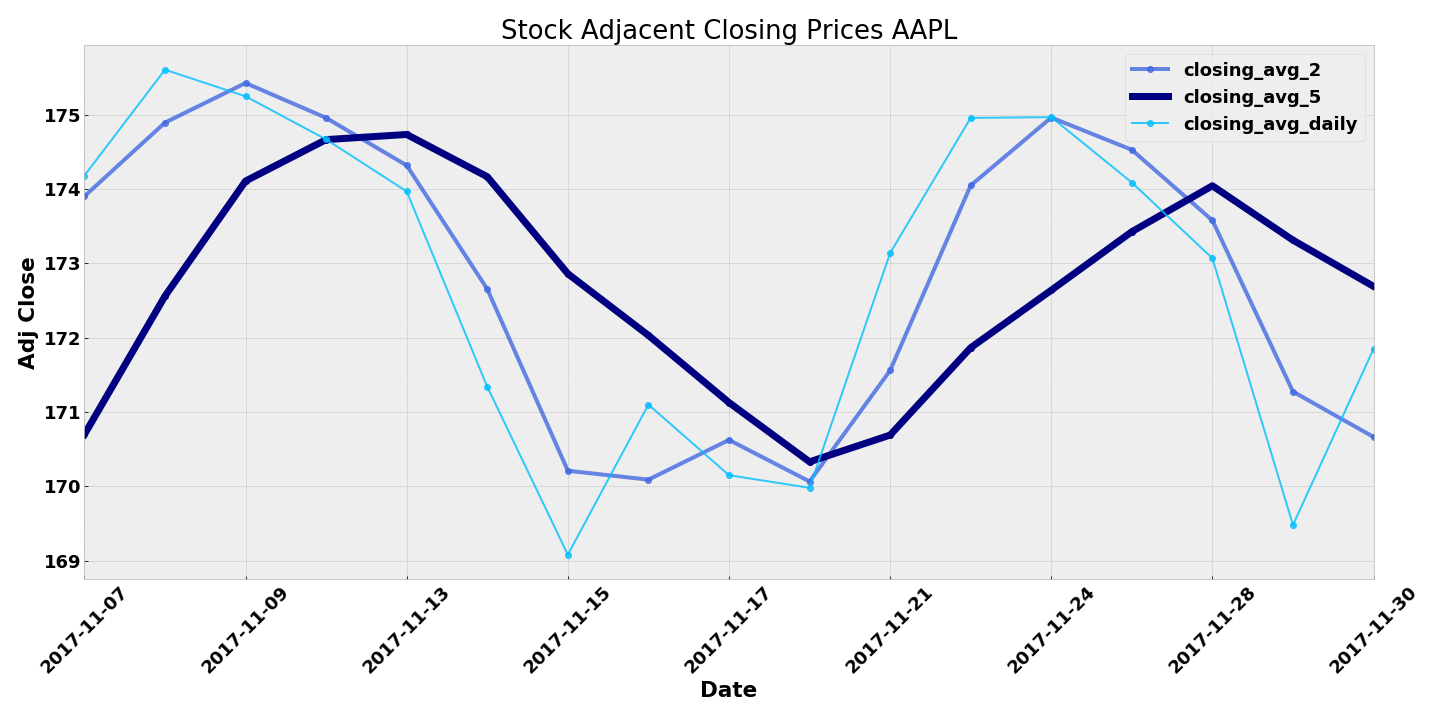
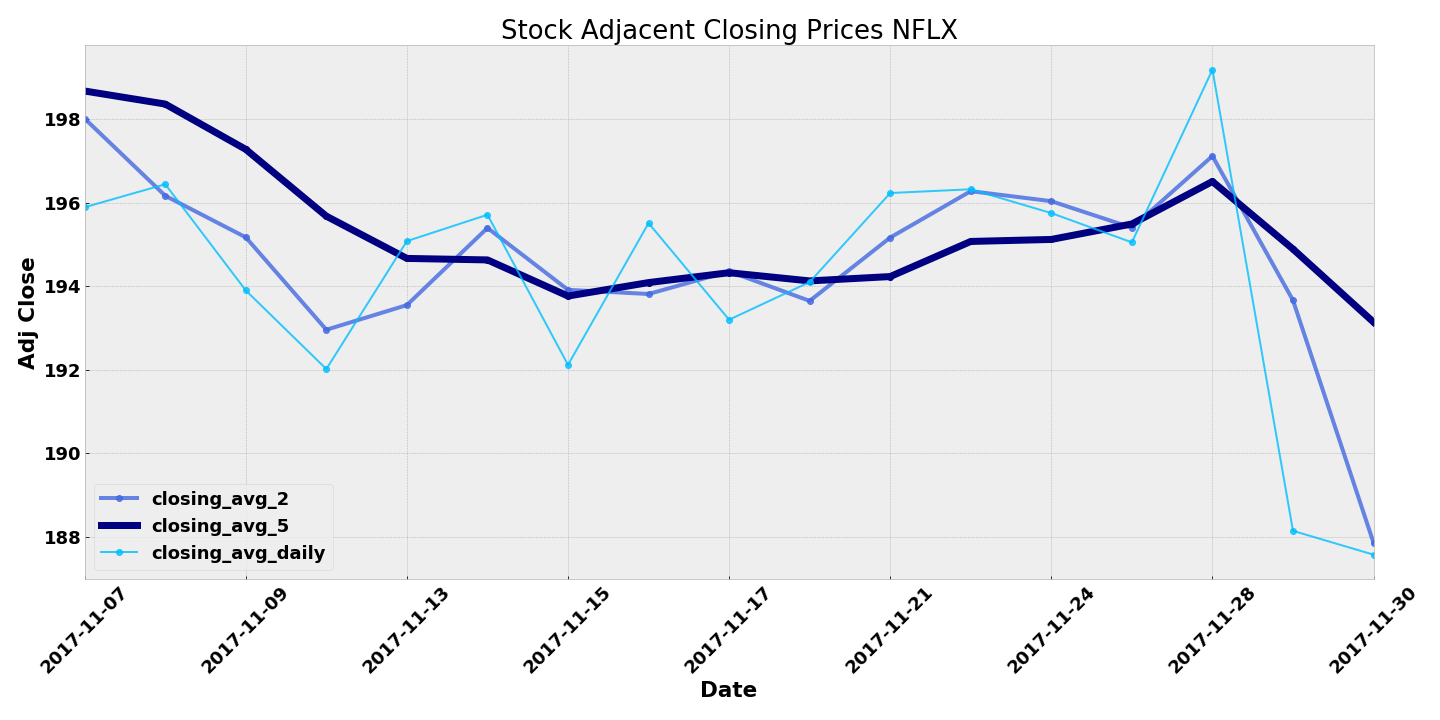
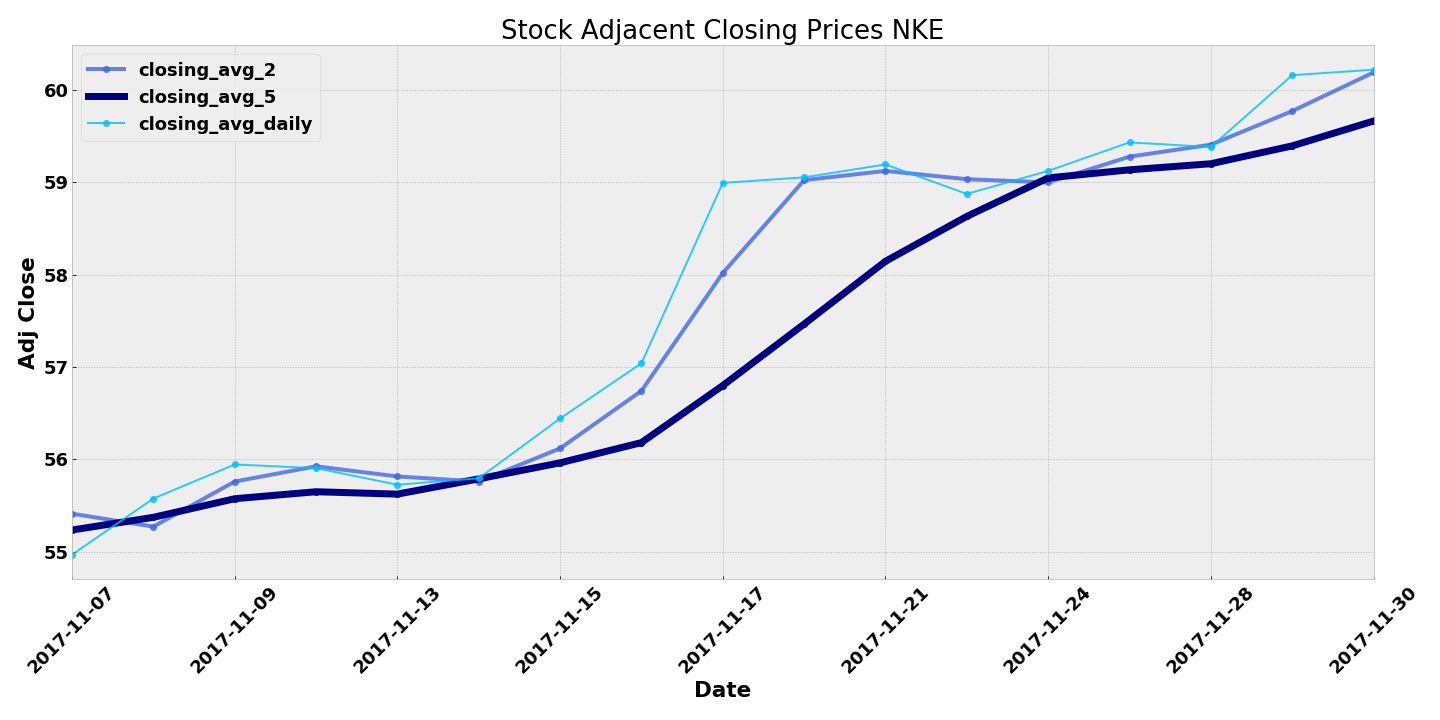
Stock prices (daily, two-day, weekly) averages